In lab on Wednesday we learned about different types of maps, in particular the isarithmic map, choropleth map, proportional symbol map, and dot density map.
- Isarithmic maps or contour maps use the lines of the contours, to identify the difference between them. They do not respect boundaries placed on regions such as state or county lines since whatever the contours are mapping don;t. A common example of one is a weather map, showing temperatures.

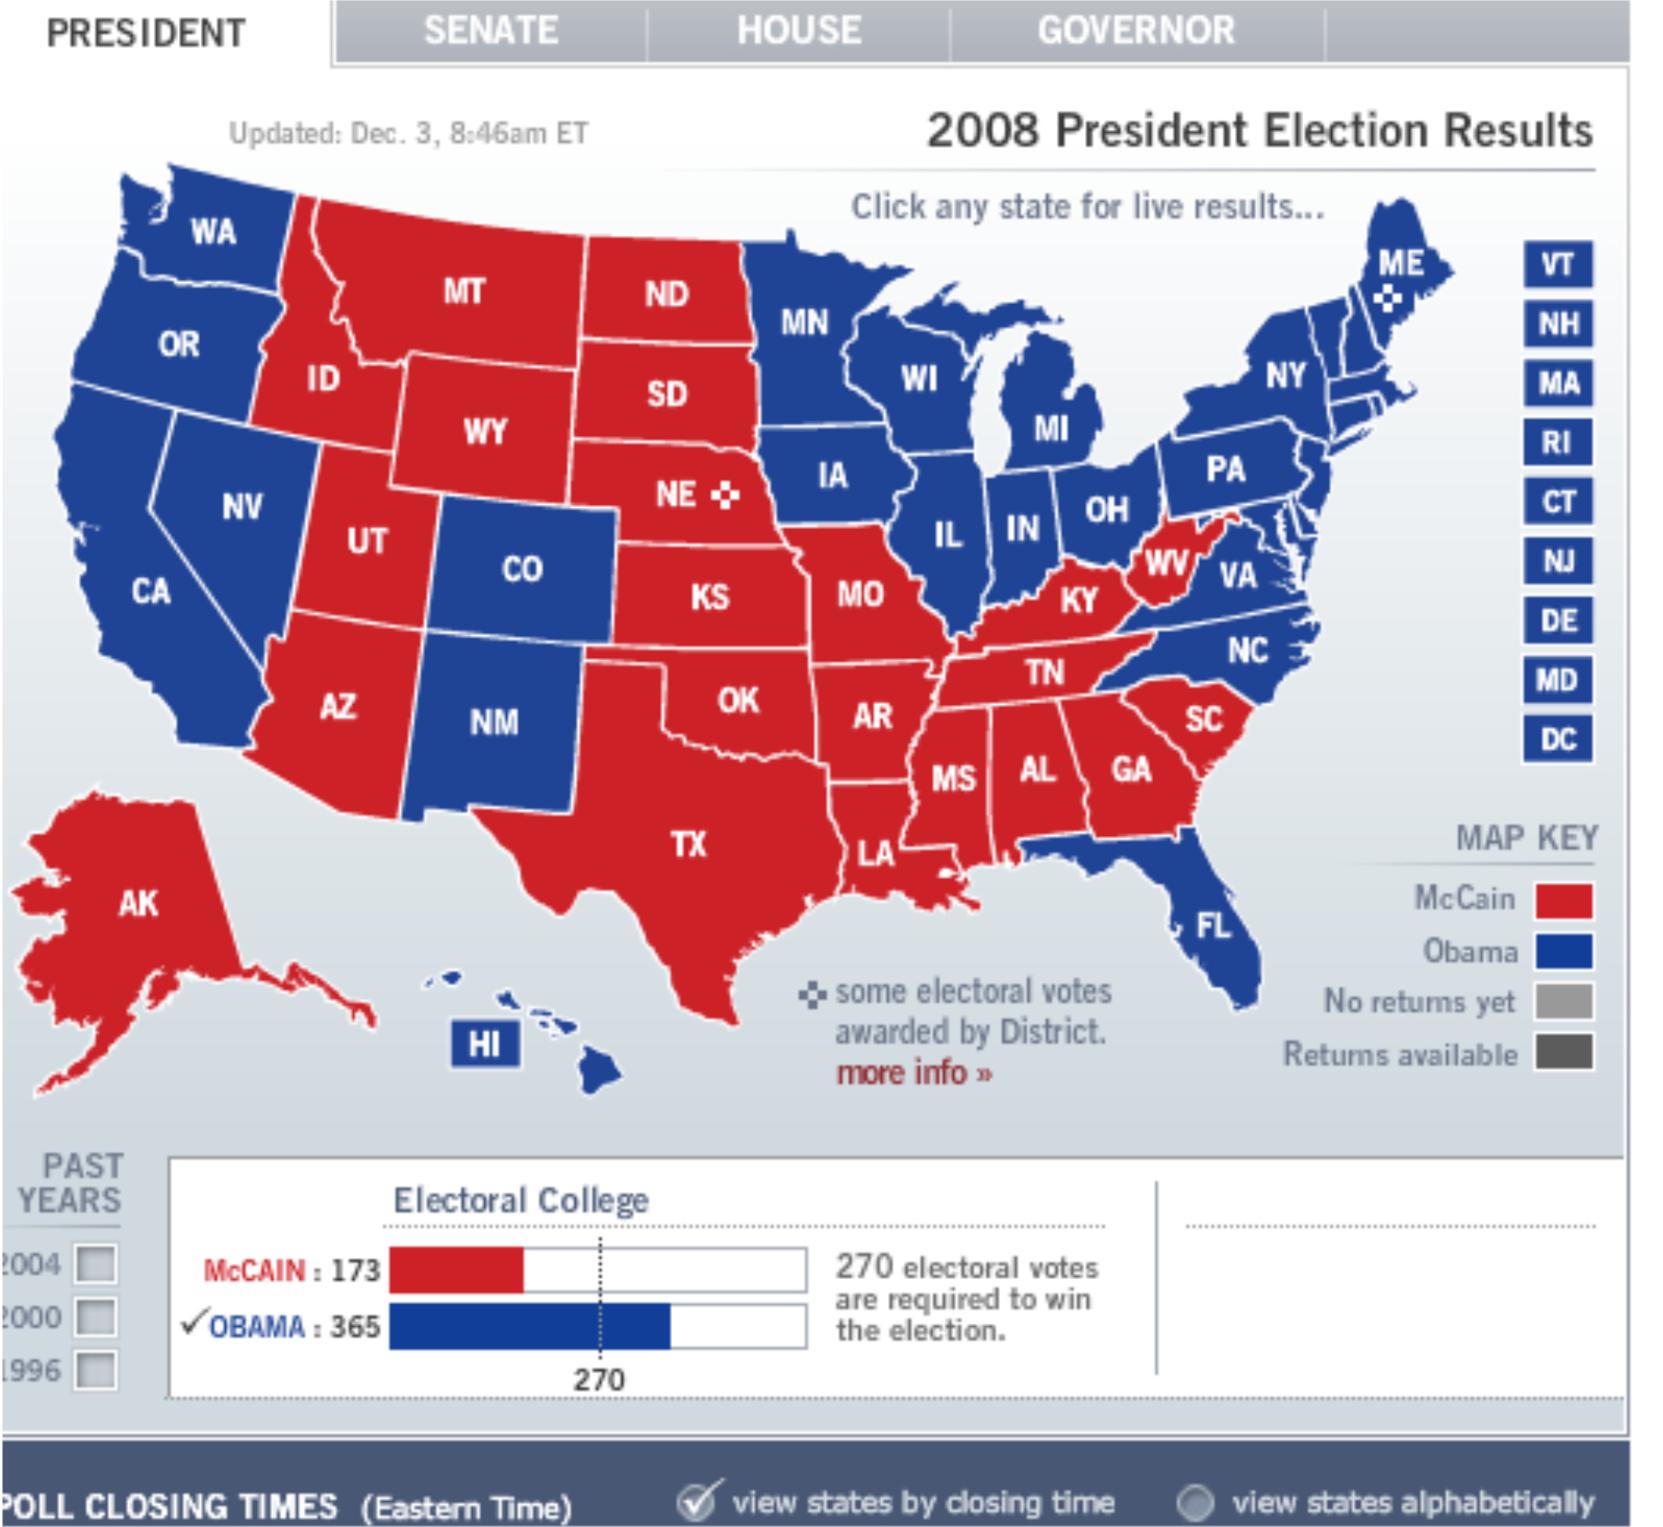
- Choropleth maps unlike isarithmic maps do stay within boundaries such a state and county lines since they are measuring something within those pre-defined regions. The regions are differetiated by color or shading. A common example for this is an election map displaying what regions went to what candidate or party.
- Dot Density maps use dot to represent an amount of whatever is being counted. A high concentration of dots indicate a high concentration of what is being measured. A population density map is an example many are familiar with. The darker, or in this case lighter, the color the more people that are living in that area.

No comments:
Post a Comment