Monday, September 26, 2011
Little Timmy The Sunflower
My little sunflower is growing slowly but surely. His little leaves are about to totally go over the lip of the cup, and there are tiny little sprouts in the dirt which are adorable. Once my camera is located there will be photos. :)
Lab #2 - Playing in the Ocmulgee
So a couple of weeks ago we had our lab that was in the Ocmulgee River. While others did things like count clams, measure flow rates, and measure elevation across a transect, I picked up trashed and discovered that baby catfish will live inside cans. I didn't actually discover it was baby catfish, since I dropped/ threw the can back in the water screaming "Oh my gosh there is something alive in there!" So here is what those other cool kids did.
Map of Clam Concentrations...I don't think you should eat these...

They found that when the water had a good steady that wasn't too fast that the clams did well. They also did well near the sand banks, but on the sand banks and in deep fast current not so much.
And here is a handy dandy graph from the river transect team, showing the elevation of the Ocmulgee River relative to how far they were from the starting point on the bank.
 This lab was a lot of fun, and we found some interesting things in the river, lots of cans, a McDonald's toy and some people even found luggage. Though we did not ride down the river on a log, or see the Ocmulgee River Monster, cousin to the Loch Ness Monster, it was a very interesting and fun lab.
Map of Clam Concentrations...I don't think you should eat these...

They found that when the water had a good steady that wasn't too fast that the clams did well. They also did well near the sand banks, but on the sand banks and in deep fast current not so much.
And here is a handy dandy graph from the river transect team, showing the elevation of the Ocmulgee River relative to how far they were from the starting point on the bank.
Wednesday, September 7, 2011
Lab #1 Cartography- Part Three- Google Earth

Lab #1 Cartography- Part Two- Handout

Monday, September 5, 2011
Lab #1 Cartography- Part One- Maps
Part One : Types of Maps
In lab on Wednesday we learned about different types of maps, in particular the isarithmic map, choropleth map, proportional symbol map, and dot density map.


In lab on Wednesday we learned about different types of maps, in particular the isarithmic map, choropleth map, proportional symbol map, and dot density map.
- Isarithmic maps or contour maps use the lines of the contours, to identify the difference between them. They do not respect boundaries placed on regions such as state or county lines since whatever the contours are mapping don;t. A common example of one is a weather map, showing temperatures.
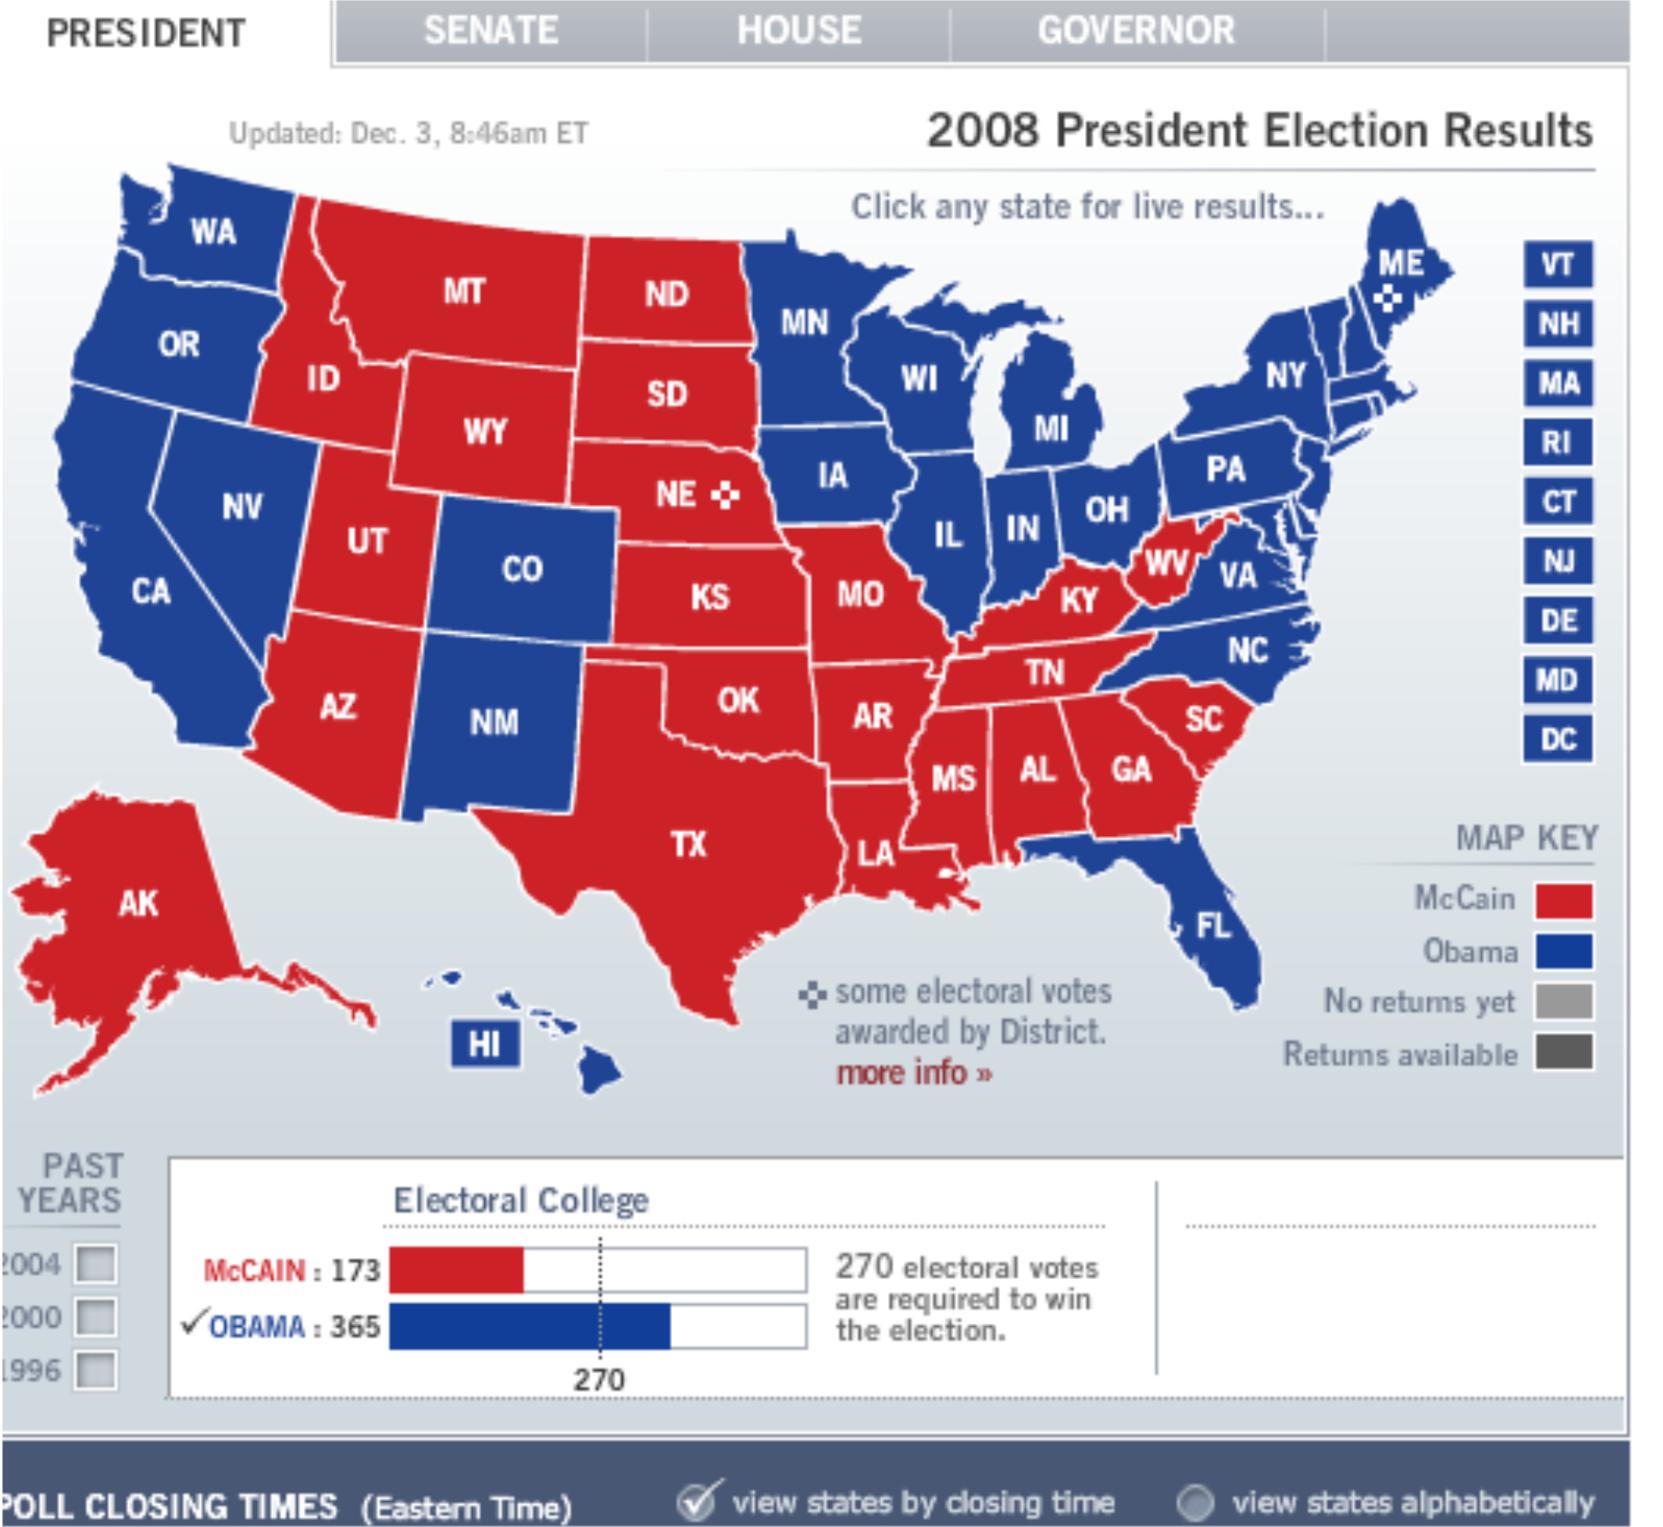
- Choropleth maps unlike isarithmic maps do stay within boundaries such a state and county lines since they are measuring something within those pre-defined regions. The regions are differetiated by color or shading. A common example for this is an election map displaying what regions went to what candidate or party.
- Dot Density maps use dot to represent an amount of whatever is being counted. A high concentration of dots indicate a high concentration of what is being measured. A population density map is an example many are familiar with. The darker, or in this case lighter, the color the more people that are living in that area.
quite possibly my favorite tree

Subscribe to:
Posts (Atom)